Category: Analytics

  • University Choice Analytics: GES 2020 Summarised for You

    University Choice Analytics: GES 2020 Summarised for You

    University Choice Analytics: Recently, the Ministry of Education of Singapore released the results of Joint Autonomous University Graduate Employment Survey in Singapore. I remembered a few years back where I would also be one of those prospective university students who would consistently be looking at these results. While I believe that your choice of university and course should not be solely on the salary that you receive, here are some analysis of the Graduate Employment Survey 2020 of 138 Courses on which University and Course you should go to: (i.e. National University of Singapore, Nanyang Technological University, Singapore Management University, Singapore University of Technology and Design, Singapore Institute of Technology, Singapore University of Social Sciences)

    Top 10 Courses in University (Median Salary)

    For the top 10 (well actually 11 due to a tie) courses this year, the Median Salary (50th percentile) received by a Fresh Graduate is S$5,000 and above, with the highest Median Salary being from Nanyang Technological University, Nanyang Business School Double Degree in Business (Business Analytics) and Computer Engineering/Computing. Two other Analytics related courses from SMU and NUS also made the top 10! Do read up more on why I picked Business Analytics as a specialisation here!

    The top universities of choice seem to be Nanyang Technological University, National University of Singapore and Singapore Management University! The top course verticals (based on my own classification) are Business, Science, Medicine, Computing and Law.

    UniversityVerticalDegreeMedian Salary
    NTUBusinessDouble Degree in Business and Computer Engineering/Computing $5,400 
    NUSScienceBachelor of Science with Honours$5,350 
    NTUMedicineMedicine$5,250 
    NUSMedicineBachelor of Medicine and Bachelor of Surgery$5,250 
    NUSComputingBachelor of Computing (Computer Science) $5,243 
    SMUComputingInformation Systems Cum Laude and above $5,000 
    SMULawLaw Cum Laude and above $5,000 
    NUSLawBachelor of Laws$5,000 
    NUSComputingBachelor of Computing (Information Security) $5,000 
    NUSBusinessBachelor of Science (Business Analytics) $5,000 
    NUSComputingBachelor of Engineering (Computer Engineering) $5,000 
    Top 10 Singapore University Courses in terms of Median Salary.

    Bottom 10 Courses in University (Median Salary)

    For the bottom 10 (12, due to tie) courses this year, the Median Salary received by a Fresh Graduate was S$3,000 and below. The Universities in this list is a good mix of technological and newer universities, with a combination of verticals from Business, Education, Science, Medicine and Humanities and Social Sciences.

    UniversityVerticalDegreeMedian Salary
    SUSSEducationBachelor of Early Childhood Education$3,000 
    SUSSBusinessBachelor of Accountancy $3,000 
    NTUBusinessAccountancy $3,000 
    NTUMedicineBiomedical Sciences and Chinese Medicine$3,000 
    SITBusinessBachelor of Hospitality Business with Honours $3,000 
    SITScienceBachelor of Food Technology with Honours $2,975 
    SUSSBusinessBachelor of Human Resource Management $2,950 
    SUSSBusinessBachelor of Science in Marketing $2,900 
    NTUHumanities and Social ScienceArt, Design and Media $2,800 
    SITHumanities and Social ScienceBachelor of Arts with Honours in Communication Design $2,800 
    SITHumanities and Social ScienceBachelor of Arts with Honours in Interior Design $2,700 
    SITBusinessBachelor of Business Administration in Food Business Management$2,625 
    Bottom 10 Singapore University Courses in terms of Median Salary.

    Analysing by the Verticals

    With so many options, it might be difficult to narrow down your options. Therefore, we are making it simpler for you through summaries of which course vertical you might want to select! We have done the analysis using Excel Pivot Tables and Charts to Visualise the results for you! On average, you will expect to receive the highest salary in Law and the lowest from Humanities and Social Sciences.
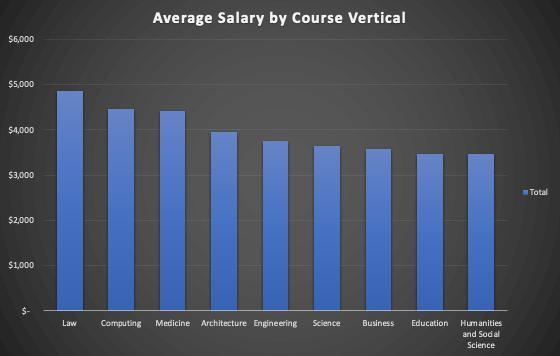
    Visualising and Ranking the Average Salary for a Fresh Graduate based on course vertical.
    Law $                      4,863
    Computing $                      4,455
    Medicine $                      4,425
    Architecture $                      3,950
    Engineering $                      3,754
    Science $                      3,651
    Business $                      3,574
    Education $                      3,475
    Humanities and Social Science $                      3,462
    Some numbers if you are interested in the specific numbers derived through excel pivot tables.

    Analysing by the Universities

    With 6 Universities, you may also want to know which university would give you the largest return in terms of salary! Here’s another analysis with Excel Pivot Tables and Charts for Visualisation! From the Data, we can see that Singapore University of Technology and Design has the highest starting salary and Singapore University of Social Sciences having the lowest.
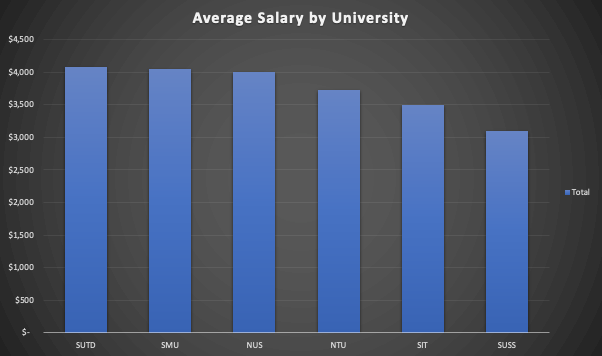
    Visualising and Ranking the Universities by Salary.
    SUTD $                      4,075
    SMU $                      4,053
    NUS $                      3,995
    NTU $                      3,731
    SIT $                      3,494
    SUSS $                      3,100
    Another set of specific numbers if you are into the details.

    Best Course Vertical in terms of Median Salary in Each University

    In this part, we wanted to know verticals had the highest salary for each of the universities. Here are the answers!

    Nanyang Technological University: Business, Computing, Medicine

    National University of Singapore: Law, Computing, Medicine

    Singapore Institute of Technology: Computing

    Singapore Management University: Law, Computing

    Singapore University of Social Sciences: Humanities and Social Sciences

    Singapore University of Technology and Design: Engineering

    Analysing the best course in terms of average salary in each university.

    Conclusion

    Having said all these, do note that this report is only informative in nature. While the starting salary may be an important factor, remember that that is only one of the considerations. Some other factors include passion, interest and more!

    Hope that this article is helpful in making an informed choice for the next phase of your education!

    If you ended up deciding on Business School, do read our post on how to make the most of your business school experience!

    If you liked this page, do bookmark this site, or follow us on our LinkedIn page.

    Original Cover Photo by Tan Wei Xiang (University Logos from Google Images)
    Datasets obtained from Singapore Ministry of Education: https://www.moe.gov.sg/post-secondary/overview/autonomous-universities/

  • Pricing Analytics: Maximising the Value of Your Ramen

    Pricing Analytics: Maximising the Value of Your Ramen

    Have you always been intrigued by how Ramen Restaurant priced their dishes? Most of the time, the Ramen is a modular product, which can be broken down into many ingredients: The Ramen, the broth, the toppings, etc. Today, we have specially broken down the prices on the menu of a Ramen restaurant which has recently set up an outlet in Singapore, and present to you this pricing analytics piece. Our main questions of the day is how much is each component of the ramen valued at, and which item on the menu gives the most value.

    The Dataset: 15 Bowls of Ramen

    To start off, we found the menu of a restaurant (which we shall not link because we aren’t sponsored, and also potentially not wanting to swing the sales for the restaurant after our analysis.)

    Next we listed the prices, as well as the ingredients offered. This will be the dataset that we would use.

    Menu and Price of Ramen
    Menu and Price of Ramen

    Exploratory Data Analysis

    Firstly, let’s get the assumptions out of the way. For this case, the base ramen is assumed as the same for everything in the menu. We also assume that having “Chef’s Recommendation” or “Most Popular” will not influence pricing, though it probably does in many business settings.

    Well, we could safely assume that every ingredient will be important in the analysis right? Ironically, no. The first step is to look at any correlated values before we do the analysis. By running a correlation plot, we realised that Spring Onions are missing only in the truffle ramen. We also learned that Leek is always in the Chicken Broth, and Bean Sprout and Pickled Onions are always in the Spicy Yuzu Broth. We are also removing truffle menu items from the analysis as they are way too different from the others and will influence the data. This way, all Tonkotsu broth has wood ear fungus too which should be removed. These data should be counted as part of the broth for a more reflective pricing model which will not exclude any variables.

    Correlation Plot of Ingredients and Price
    Correlation Plot of Ingredients with Price

    Pricing Analytics: Which Ramen is the most and least worth it?

    So we ran our model. It fits on a perfect straight line!! The restaurant was very clear on their component pricing. Basically, all the menu items were equally worth it. That was not what we expected but it’s an entirely possible outcome.

    Pricing Analytics: How much do you pay for each component in your Ramen?

    We looked at the output and thought what’s next, we basically obtained a price chart of the Ramen components! (Assuming the Base Ramen is included in the broth.)

    Ramen Price Analytics Outcome
    How each part of your ramen is priced

    If you ordered just a Tonkotsu Broth (which comes with Wood Ear Fungus) without toppings, it would be $8.90, $9.90 for chicken broth (With Leek) and $12.90 for a Spicy Yuzu Broth (With Pickled Onions and Bean Sprout). Each of your toppings of each Belly Chashu, Hanjuku Egg and Collar Cha Shu is $2 Each. Your Seaweed is more or less free and should not be calculated into the equation, but you do get a bigger seaweed for your large bowls so this should be a plus point!

    In conclusion when ordering your ramen, pick the bowl which gives you seaweed of your choice (at least in this store.). In addition, now you have this chart to make a rational decision when ordering Ramen in future.

    Hope you liked our post today. Hope that this post will inspire you to do your own analysis of your favourite restaurant menus. If you’re interested in starting your own Ramen restaurant, do take a look at our business model analysis here.

    Do bookmark this site, leave a comment in the section below, and follow us on our LinkedIn page as we look forward to curating new content for you every week. Next, do read about how we used Google Analytics to Analyse our top and bottom posts of 2020, or on how we text mined 400 spam comments!

    Image Credits: Photo by Hari Panicker on Unsplash
    Artwork Designed by Tan Wei Xiang

  • Using Google Analytics to Discover our Tops and Flops of 2020

    Using Google Analytics to Discover our Tops and Flops of 2020

    Welcome to our first post of 2021! As promised in the previous post to be more regular in posting the various topics in this blog, we are kick starting the year with analytics to discover our top 5 and bottom 5 posts (credit the tops and flops inspiration from one of my colleagues who loves to use that in her weekly review at work), to better understand the content which interests you, the reader!

    From the cover slide, we can somewhat see that the traffic has been rather cyclical, perhaps we can expand more on that trend in future but today, let us take a look at the top 5 and bottom 5 posts in the past 6 months. While we are currently 1200 users strong, you might also be interested in looking at our previous Google Analytics Analysis of our first 500 users.

    When dealing with analytics, as usual, we want to ask questions which we want to answer. Through the behaviour overview, and full report of Google Analytics we want to know what our best and worst performing posts were.

    What are our Top 5?

    We were able to discover our top 5 posts (In terms of viewership, from the highest to lowest):
    1. Nanyang Business School Business Analytics Module Selection Guide
    2. 3 Reasons Why I picked a Specialisation in Business Analytics at Nanyang Business School
    3. University Internship Hunting Guide (Tips from NTU NBS Graduate with 3 MNC Internship Experiences)
    4. General and Unrestricted Electives Guide – From NBS Business (Business Analytics) Graduate
    5. Which Major to Pick? Business Analytics vs Marketing (Ex-NBS Student)

    These 5 posts contribute to a total of 37% of all our page views, even though they made up about 25% of all content.

    What are our Flop 5?

    We also managed to pick out our flop 5 posts (From the lowest to highest in viewership):
    1. COVID-19 Pandemic: Should I Start Work or Go Back to School?
    2. Business Model Template: Photo Studio
    3. 6 things to do for 2 Hours in Stuttgart, Germany
    4. Integrating Analytics and Management: Where and How to Start?
    5. Key Takeaways from my In-office turned Work-from-Home Internship

    These 5 posts contribute to 4.2% of all our page views, much less than the 25% of all our posts in 2020.

    Additional Remark: The clear bottom fodders were the newer posts of Christmas Text Analytics and Hair Salon Business Model which we would exclude from the analysis as they have yet to pick up, but I urge you to take a read as they are really interesting posts!

    Making sense of the insights

    Our Age Demographics for readership shows that 60% are youths, and a good 40% are non-youth readers.

    From the top 5 posts, there is a clear indication that many students visit us and rely on the information posted here for advice on their curriculum needs. We are really humbled to be able to create impact for the student audience as we always try to pay it forward after learning from the knowledge of seniors and we urge you to pay it forward in future too!

    We also noticed that it was an interesting trend that 40% of our users are a non-youth audience, and we are heartened that we are able to communicate analytics and innovation to an audience that we initially did not imagine to create impact for. Do let us know which content you love in the comments below!

    For the flop 5 posts, one of the central themes which surround these posts is for instance, it being no longer specific to analytics, which we relaunched the blog on (yes we used to include lifestyle posts and travel.), or the very slight reference to the epidemic which shall not be named since this is risk of lowering the search engine score of this post (we instantly apply these insights!!). We hope to continue bringing new content and will continue to generate more content which caters to your hunger for learning about analytics, innovation and management!

    Additional note: We initially wanted to add in a text analytics, but we realised that there isn’t enough posts to do that on this post without getting just words that are repeated non-stop. If you liked the text analytics, you could look at our ranked 6th post, What I learned from Text Mining 400 Spam Comments on my Blog using R, to see what spam users like to write in our comments section.

    If you liked our post, do bookmark this site, or follow us on our LinkedIn page as we look forward to creating new content for you every week. Wishing you a Happy 2021!!!

    Image Credits: Original Image created by Tan Wei Xiang

  • My Reflections on 2020

    My Reflections on 2020

    2020 might be remembered in history as a year of widespread epidemic and economic recession by many, but to me, it was a really interesting year. It was a year which challenged me to do the best I could.

    1st Half of 2020

    Kick started my first half of 2020 with my final semester at Nanyang Technological University, taking 3 modules, inclusive of the legendary killer Capstone Business Analytics Module in NBS, Business Analytics Consulting. I had the chance to interact with the brightest minds from business, as well as computing, to deliver viable business recommendations in health insurance strategy to our client company, Aon. Click here you’re interested to know more about why I chose business analytics.

    As if dealing with one company was not enough, I took on a Regional Digital & Product Marketing internship with dental company KavoKerr, which recently spun off from Danaher Group. Through the internship, I had the chance to conduct market research, create marketing collaterals, do customer analytics, as well as social media marketing on Facebook. Halfway during my internship, it became a work-from-home arrangement, do read this if you’re interested to know how it is to experience both work in office and at home.

    Right after finishing my final class in business school, I managed to secure a job and it was in semi-lockdown in Singapore. Instead of just wasting the time away, I decided to upskill myself through distance learning on Coursera, here are some of my reflections.

    2nd Half of 2020

    Kick Started the second half of 2020 with my first job on a Graduate Programme with Dairy Farm Group, a multinational company in the retail and fast moving consumer goods scene. Managed to get a chance to learn a lot at work through rotations in Commercial, Operations and Supply Chain. I am really fortunate to have had the chance to interact with many senior business leaders as well as mentors to guide me along the way, and looking forward to more growth in my career. If you’re interested to find out more do reach out to my LinkedIn, where I have documented many posts on the experience too!

    For the last few months of the year, I made the choice to return to campus in NTU, to further my understanding of the business sector by taking on a MiniMasters in Marketing Management. While it has been tiring to juggle work with studies, it has been really fulfilling to tackle marketing problems with the brightest minds. (Some have even been in the industry for years!) If you’re considering going back to school while working, do click here!

    Last but definitely not the least, I am happy to have consistently posted blog posts this half of the year despite never quite getting myself started previously. Thank you all for the readership this year and we look forward to your continued support over 2021 where we will bring you more posts about analytics, management and innovation.

    My thoughts for 2021

    Moving forward to 2021, it will be a year of accelerated learning at work, while also completing my MiniMasters programme by the end of March! (Hopefully graduation too, but I am not too sure if it will ever happen now.)

    Most importantly, I realised I have not been the most consistent in posting this year, sometimes disappearing occasionally when busy. A resolution for this blog is to consistently generate at least one post for each topic in analytics, innovation and management on a monthly basis, while also not forgetting some of my readers who are still in school as well. Do look forward to more about my past university experience as well as a fresh employee at work perspectives.

    2020 has been great, 2021 will be even better!

    Tan Wei Xiang

    Do follow our blog by bookmarking the page, or following our LinkedIn.

    Image Credits: Photo by Ray Hennessy on Unsplash

  • Text Analysis: Christmas Song Lyrics

    Text Analysis: Christmas Song Lyrics

    Merry Christmas! (Slightly late!) Growing up, Christmas jingles seem to be the part and parcel of every Christmas season, being played at many retail spaces around Singapore (and I’m sure it is in many other parts of the world too.) We’ve decided to carry out analytics on some common Christmas Songs which we recall from a list found online. We then searched for the lyrics data through Google before analysing the data. Presenting to you the word clouds for Christmas. Hope you will like the post and do follow us on our LinkedIn.

    Twelve Days of Christmas

    Well it comes as no surprise for this to be the word cloud for the Twelve Days of Christmas, given that “for the x day of Christmas my true love gave to me … a partridge in a pear tree!” gets repeated 12 times and the whole phrase has no repeats.

    Jingle Bells

    Well surprisingly, sleigh appears to be the most common word used, because we only inputted the chorus in once, and the verses mentioned sleigh a few times.

    Santa Claus is Comin to Town

    Whoever wrote this song was definitely really sharp at using better in a lot of phrases, along with good coming in next place. Despite having shout and cry in the lyrics, the word better has been strategically used to give off the positive connotations in the song to be good and better. Did you realise that previously? Let us know in the comments below.

    Rudolph the Red Nose Reindeer

    No wonder we remember reindeers are supposed to have red noses!

    Rockin Around the Christmas Tree

    Rock around the Christmas Tree! Another catchy song which repeats the same over and over. Maybe this is the secret formula to a great Christmas song.

    Let it Snow! Let it Snow! Let it Snow!

    Speaks for itself, just repeat the title non-stop and you’re ready to launch your next Christmas hit! Thank me when you’re famous.

    Jingle Bell Rock

    Well the writer of this song definitely took repeating the title non-stop to a whole new level, even including jingle and bell in the verses. Jingle was repeated for a total of 28 times!

    Last Christmas

    Well we finally have another formula for Christmas songs, it is to make the audience feel special and the idea of giving gifts and all through negative words with positive meanings. The writer is using the Santa Claus is coming to town formula to succeed.

    Conclusion

    Overall, if you want a hit Christmas song, think of Jingle Bells or the thought of giving, or just mentioning the word Christmas works too. You could give it a shot using negative lines but add words with positive connotations or just repeat the title non-stop.

    You are now on track to become the next Christmas Song writer! Hope you liked the post, do follow us on LinkedIn, and Bookmark this site. Merry Christmas and Happy New Year!

    Image Credits: Photo by Jonathan Borba on Unsplash

    Like more text analytics? Do look at our post here!