Category: Analytics

  • Nanyang  Business School: Business Analytics Module Selection Guide

    Nanyang Business School: Business Analytics Module Selection Guide

    You have finally decided that you want to do a business analytics curriculum, and want to know what you have in store for you in analytics; you log into the system and find out that there is so many courses available (correct as of July 2020):

    Specialisation Core Courses

    BC2402 Designing & Developing Databases
    BC2406 Analytics I: Visual and Predictive Techniques
    BC2407 Analytics II: Advanced Predictive Techniques

    Specialisation Prescribed Electives –
    Choose 3 Specialisation Prescribed Electives:
    AC2401 Accounting Information Systems
    BT2403 Service Operations Management
    BC2408 Supply Chain Analytics
    BC3402 Financial Service Processes & Analytics
    BC3405 Lean Operations & Analytics
    BC3406 Business Analytics Consulting (I did this)
    BC3408 Decision Modelling & Analytics (I did this)
    BC3409 AI in Accounting and Finance
    New Course Programming for Business Transformation

    Information from NBS Website

    Business Analytics Core

    The three cores are necessary to take and you would not be able to avoid them. Something new to you is probably the addition of prescribed electives, where you can pick 3 modules (or more if you want to) to add up to your final degree in Business Analytics!

    Business Analytics Sub-specialisations

    Something you may want to note is that in Business Analytics we unofficially have sub-specialisations too! I have classified according to how seniors have looked at how the courses fit in and also added my own opinion with regard to the newer modules.

    Finance Analytics Track:

    AC2401 Accounting Information Systems (Sem 1 & 2)
    BC3402 Financial Service Processes & Analytics (Sem 2)
    BC3409 AI in Accounting and Finance (Sem 2)

    Operations Analytics Track:

    BT2403 Service Operations Management (Sem 1)
    BC2408 Supply Chain Analytics (Sem 2)
    BC3405 Lean Operations & Analytics (Sem 1)

    Management Science & Analytics Consulting Track:

    BC3406 Business Analytics Consulting (Sem 2)
    BC3408 Decision Modelling & Analytics (Sem 2)
    New Course Programming for Business Transformation

    What modules did I pick?

    Prior to my year, there were modules which form a marketing analytics track. I was really interested in taking those modules, but unfortunately they were no longer offered. I decided to go with the next best alternative, which was in Management Science & Consulting. I took BC3407 R & Python, now restructured to the GER-Core BC0403, as well as BC3408 Decision Modelling & Analytics and BC3406 Business Analytics Consulting. On top of that, I stayed true to my initial interest by doing an unrestricted elective which is offered by the marketing department, BM2507 Marketing Analytics (Unfortunately not a Business Analytics Prescribed Elective though moving forward I hope it gets approved as one as inter-disciplinary knowledge is increasingly important).

    While not the most commonly picked modules by most Business Analytics students, with very little seniors with precedent knowledge, I believe that benefitted greatly from taking the modules which I have taken and look forward to sharing more.

    What modules should you pick?

    At the end of the day, there is no fixed best modules to take, but rather what aligns with your passion and purpose. My advice is to picture where you see yourself in future, and take the modules to build yourself in that direction. Hope this helps with your module planning!

    If you liked our post, do follow us on our LinkedIn, or our writer’s personal LinkedIn Account for more tips.

    Now that you are done with planning your prescribed electives, you may want to read about general and unrestricted electives over here.

    You may also be interested to pick between business and marketing.

    Here’s another blogpost from a senior which I previously got some reviews and found really helpful!

    Photo Credits: Photo by Wengang Zhai on Unsplash

  • What I learned from Text Mining 400 Spam Comments on my Blog using R

    What I learned from Text Mining 400 Spam Comments on my Blog using R

    Hey everyone! Welcome back to another amazing analytics post this week. If you are a frequent visitor of my blog, and somehow made a genuine comment here, you would have noticed your comment never appears. If you saw the screenshot above, out of a total of 999 comments, I have marked 400 as spam.

    I was reading through some really interesting comments on my blog and I was thinking, why not try doing some text analytics to see what are spammers most interested in talking about on my blog.

    Some simple explanation, text mining is a common way to do sentiment analysis on long lines of text which many market researchers do not want to look through. By going through specific text found in the whole data, researchers want to find out what the general public is talking about. In this instance, I want to find out what spam comments are generally being posted to my blog.

    A bit of Data Cleaning: The very manual and boring part…

    I started off by copying 400 comments and saving it inside a txt file. As my professor always said, data analytics is about 80% data cleaning and 20% analysis. I would change the 20% analysis to 19% and add 1% in terms of insights, which is what the business world truly values.

    My First Round of Analysis

    After a whole massive cleaning exercise here are the first set of results, represented in a word cloud of my top 30 most popular words in the spam.

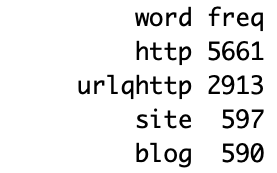
    The most popular keyword is http… Which means people are spamming websites.

    The most popular keyword in the list of comments is http, which many websites start with (https was also likely in the list with the s being removed and recoded as http.) The second most popular keyword is urlqhttp which is probably also a website.

    In 400 posts, there were close to 8000 times http has appeared.

    In 400 posts, there were close to 8000 instances a web address has appeared, which means on average, spammers were posting 20 links to my blog. (They are probably trying to create backlinks to their website to improve their search engine rankings, which also will damage my website search engine ranking if it has too many backlinks out.) Thankfully these comments did not see the light of day.

    Site and blog were the next highest which would make sense to come out 1.5 times per comment. Things like: This is an amazing blog/site, before adding in other things.

    These links all appeared 582 times, which should be more or less safe to assume they are posted by the same poster.

    These websites were also the most frequent in the comments, in the same frequency, it is likely that a bot has been created by a poster to consistently post the same thing over and over again. (Or perhaps he is that free and did it manually.) It was nice to know that spammers on my blog is interested in reviews, trips and books, linking things, and some German place which consists of Freiheit, which means political freedom (Yes, I learned German for 4 years before.). I did not open the links as I was worried of any potential spyware.

    Okay that is enough analysis for today. If you are interested, do drop by for round 2! If the viewership is high enough, I’ll likely run another analysis on more comments in future.

    If you liked the analysis, you may like this analysis too!

    https://tanweixiang.com/what-i-learned-from-analysing-500-new-users-using-google-analytics/

    Otherwise you might want to know how to put analytics and management together!

  • 3 Reasons: Business Analytics at Nanyang Business School

    3 Reasons: Business Analytics at Nanyang Business School

    Having recently graduated in Business Analytics, here are 3 reasons why I picked Business Analytics:

    1. Management Science and Problem Solving Skills

    My biggest takeaway from doing a business analytics degree was that merely knowing how to code in R, Python, SQL, etc does not make you a good business analytics student. Instead, understanding the problem forming and solving framework is key in tackling any business problems which we want to solve. All my modules consisted of heavily hands on projects for me to exercise good business sense, along with a sprinkle of technical and statistical flavour.

    Ultimately, in order to succeed in Business Analytics, it is not about how good your algorithm is, but how your proposed solution solves the problem at hand! While coding is a must-know, it is definitely not the crux of business analytics.

    You may be interested in this article if you would like to get started on bridging between analytics and management.

    2. Classroom Diversity and Versatility

    Business analytics gave me the chance to meet classmates with a variety of interests. I enrolled into business analytics to make an impact in the marketing and management sectors and adding value through analytics. While going through the Business Analytics curriculum, I managed to also embark on Human Resource projects, as well as a real-life business analytics consulting project with Aon. Do stay tuned in future for updates.

    I had the opportunity to interact with friends working in various sectors, including Finance, Supply Chain, Logistics, Consulting, Data Science. Previously, I had internships in Market Intelligence, Digital Marketing, Product Marketing and Human Resources in the Automotive, Information Technology and Medical Devices sector. Currently, I’m putting my knowledge to the test in the retail sector!

    Hence, you can see that the beauty of business analytics is that it can be used anywhere!

    In the meantime, here is a post on how to maximise your experience in Business School!

    3. Relevance of Business Analytics in Industry 4.0

    Initially, I took business analytics to future proof myself. All around the world, we hear buzzwords like Industry 4.0, or big data being the next big thing. Especially in Singapore, there is an increased emphasis on Technology and Analytics. All the universities in Singapore have started offering analytics as part of their degree programme offerings. In NBS, the analytics cohort in 2018 (Based on the database classes, our core module) was 4 classes, in 2020 it has almost doubled to 7 classes. Therefore, we can see a clear increase in supply of classes to meet the increasing industry demand. (Hope you like the casual economics, and fun fact some countries call business analytics econometrics!)

    Do stay tuned to some of my future blog posts on my Business Analytics curriculum review as well as other topics in the near future!

    Next, you may want to read this module selection guide if you have decided on Business Analytics! Otherwise, you may want to read this to select your General and Unrestricted Electives.

    We have also did a tiering of modules in NBS and NTU on our Youtube Channel!

    If you liked our post, do bookmark this site, or follow us on our LinkedIn page as we look forward to creating new content for you every week.

    Image credits: Photo by Luke Chesser on Unsplash

  • Integrating Analytics and Management: Where and How to Start?

    Recently, while at work, I was given the opportunity to run some data analytics on some data in order to create some business insights and recommendations for a colleague. While I have learned about Business Analytics while in school, implementing it in real life as a one-man analyst is not just a walk in the park.

    After practicing in real life and coming out with some insights so far. Here are some possibilities you could explore if you are keen on introducing data analytics into your day-to-day management work.

    1. Establish the Goal of your Project

    When given a project, there is surely an end goal which is required by whomever has assigned you the project. One way to establish the end Goal of the project is to ask the project leader who has provided the project. If he or she does not have a goal in mind, you could look into the data to propose the possibilities. With a goal, it would be easier to scope your project.

    2. Determine the Nature of the Project

    Once you have established your goals, you will have to figure out the nature of your project. Is it more descriptive in nature? Or more predictive? Do you want to see what your data says, or try to use the data to predict something else? With the nature of the project in place, it would help you to know whether you should be focusing on descriptive or predictive methods, especially since there is so many analytics tools out there and there is no way you can try everything on the same project in a limited period of time.

    3. Try your Visualisations and Models

    With so many models out there, which to use? I am also in the process of figuring this out and you could stay tuned to future blog posts if I come across the chance to do more projects.

    For now, a good example of visualisations can be through Tableau, Google Analytics and Excel Charts.

    A good example of models can be Machine Learning Models through R, Python and Microsoft Excel.

    4. Prepare Insights, Recommendations. Rinse and Repeat

    Once you are done with your models, you have to summarise your insights which are paired with specific recommendations. You can then engage your project leader, check if everything is going along the right direction. Over time, if you can continue to work on the project, find ways to consistently relook at the data, the insights and think of ways to improve the model and the connect to the business.

    At the end of the day, when you are doing analytics, always focus on the needs and requirements of the business to propose strong insights and recommendations, and not the models which you are using.

    If you’re interested in how to formulate insights, do take a look at my analysis of 500 users on Google Analytics.

    Looking to improve on your skills amidst this pandemic? Here are some skills you could learn to future proof yourself!

  • What I Learned from Analysing 500 New Users Using Google Analytics

    What I Learned from Analysing 500 New Users Using Google Analytics

    Hi everyone! It’s been quite a while since we had a new analytics post. This time, we are doing some analytics on our own website here at https://tanweixiang.com/. Over the past two months, we have gained close to 500 new users, and therefore we decided to curate this special post as a reward to show some behind the scenes web analytics.

    Do read this post, click around, share it, for us to have more complex data to be analysed in future!

    A quick overview of Google Analytics, there are some general reports on Audience, Acquisition, Behaviour and Conversions. Audience is basically who views our posts. Acquisition answers the question on how we get the audience. Behaviour answers questions on what content our audience may be more interested in. We would not be writing about conversions as we have not researched too much into this yet.

    The types of reports available on Google Analytics.

    Audience

    1. Most of our Audience are from Singapore.

    For the past two months, Top 3 Audience are from Singapore, United States and Hong Kong.

    For the past two months, our top 3 Audience are from Singapore, United States and Hong Kong. It is aligned with our expectations as the content is mostly tailor made for Singapore, and shared through social media accounts with a high Singapore following.

    2. Most of our Audience access the website with a Mobile Phone or Tablet.

    Top 3 Systems used are Android, iOS and Windows.

    From this, we found out that 80% of our audience access the website using a mobile phone or tablet. Therefore, we know that it is important to keep our system optimised for mobile phones and tablets, which typically have a smaller screen size than laptops and desktops.

    Acquisition

    1. While Largely Driven by Social Media, We have grown a Direct Audience and Achieved some SEO.

    About a third of our audience comes through direct and search engine traffic.

    While social media remains the key to some of the post traffic, we are heartened that there is also a large amount of organic traffic coming in. With this, we feel more confident in curating original content for great readers like you.

    While we’re at this, do take a look at one of our posts which may have been missed on:

    2. Our Top Social Media Traffic is LinkedIn, While Instagram Follows Closely Behind

    Linkedin, Instagram and Facebook are our top 3 social media.

    LinkedIn remains as the top source where users visit. A key possibility is that the blog attract more readers in the Business sector. Being a blog on Analytics, Innovation, Marketing and Management, this is consistent with the expected audience. Instagram remains close behind as student content also drives some of the traffic for the website.

    Behaviour

    1. Our Readers Tend to stay on Each Page for 1.5 Minutes.

    The average time each user spends on a page.

    1.5 minutes is the current duration our readers tend to spend on a page. The implication could be that the content may or may not be interesting enough, or just the vast sea of content all around and there is not enough time to read through everything. When we manage our own digital posts, we could try to benchmark on how long to post, in order to ensure that the attention span of the audience is not overlooked.

    2. Our Top Pages includes the Root Domain, as well as posts catered to Business School/ University Life

    Our top 3 posts, as well as our main page.

    This summary of views by page title indicates the content which interests readers more. A good blog post generates great viewership, this is why we will continue to curate posts which interest you as the reader.

    That is all for the analysis for today! Hope you enjoyed, do follow us on our channels, we only have linkedin so far! https://www.linkedin.com/company/tanweixiang/

    To read some of our top posts, do click the links below:

    https://tanweixiang.com/ntu-nbs-internship-hunting-guide-tips-from-an-nbs-graduate-with-3-mnc-internship-experiences/
    https://tanweixiang.com/three-reasons-why-i-picked-a-specialisation-in-business-analytics-at-nanyang-business-school/