Tag: analytics

  • Pricing Analytics: Maximising the Value of Your Ramen

    Pricing Analytics: Maximising the Value of Your Ramen

    Have you always been intrigued by how Ramen Restaurant priced their dishes? Most of the time, the Ramen is a modular product, which can be broken down into many ingredients: The Ramen, the broth, the toppings, etc. Today, we have specially broken down the prices on the menu of a Ramen restaurant which has recently set up an outlet in Singapore, and present to you this pricing analytics piece. Our main questions of the day is how much is each component of the ramen valued at, and which item on the menu gives the most value.

    The Dataset: 15 Bowls of Ramen

    To start off, we found the menu of a restaurant (which we shall not link because we aren’t sponsored, and also potentially not wanting to swing the sales for the restaurant after our analysis.)

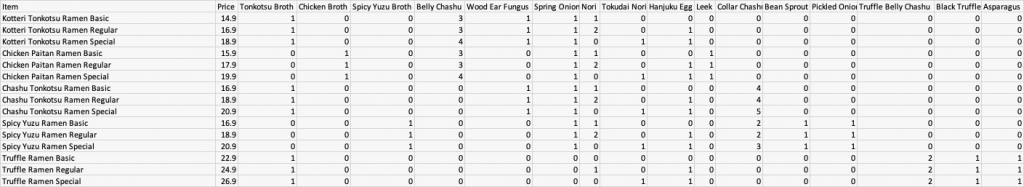
    Next we listed the prices, as well as the ingredients offered. This will be the dataset that we would use.

    Menu and Price of Ramen
    Menu and Price of Ramen

    Exploratory Data Analysis

    Firstly, let’s get the assumptions out of the way. For this case, the base ramen is assumed as the same for everything in the menu. We also assume that having “Chef’s Recommendation” or “Most Popular” will not influence pricing, though it probably does in many business settings.

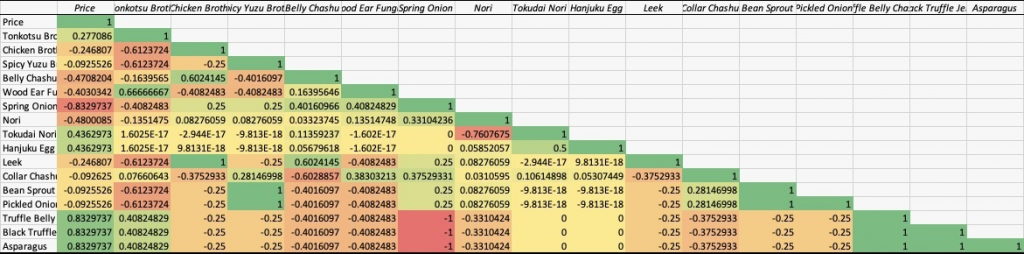
    Well, we could safely assume that every ingredient will be important in the analysis right? Ironically, no. The first step is to look at any correlated values before we do the analysis. By running a correlation plot, we realised that Spring Onions are missing only in the truffle ramen. We also learned that Leek is always in the Chicken Broth, and Bean Sprout and Pickled Onions are always in the Spicy Yuzu Broth. We are also removing truffle menu items from the analysis as they are way too different from the others and will influence the data. This way, all Tonkotsu broth has wood ear fungus too which should be removed. These data should be counted as part of the broth for a more reflective pricing model which will not exclude any variables.

    Correlation Plot of Ingredients and Price
    Correlation Plot of Ingredients with Price

    Pricing Analytics: Which Ramen is the most and least worth it?

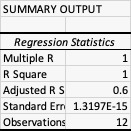
    So we ran our model. It fits on a perfect straight line!! The restaurant was very clear on their component pricing. Basically, all the menu items were equally worth it. That was not what we expected but it’s an entirely possible outcome.

    Pricing Analytics: How much do you pay for each component in your Ramen?

    We looked at the output and thought what’s next, we basically obtained a price chart of the Ramen components! (Assuming the Base Ramen is included in the broth.)

    Ramen Price Analytics Outcome
    How each part of your ramen is priced

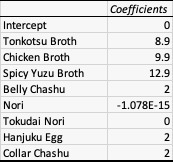
    If you ordered just a Tonkotsu Broth (which comes with Wood Ear Fungus) without toppings, it would be $8.90, $9.90 for chicken broth (With Leek) and $12.90 for a Spicy Yuzu Broth (With Pickled Onions and Bean Sprout). Each of your toppings of each Belly Chashu, Hanjuku Egg and Collar Cha Shu is $2 Each. Your Seaweed is more or less free and should not be calculated into the equation, but you do get a bigger seaweed for your large bowls so this should be a plus point!

    In conclusion when ordering your ramen, pick the bowl which gives you seaweed of your choice (at least in this store.). In addition, now you have this chart to make a rational decision when ordering Ramen in future.

    Hope you liked our post today. Hope that this post will inspire you to do your own analysis of your favourite restaurant menus. If you’re interested in starting your own Ramen restaurant, do take a look at our business model analysis here.

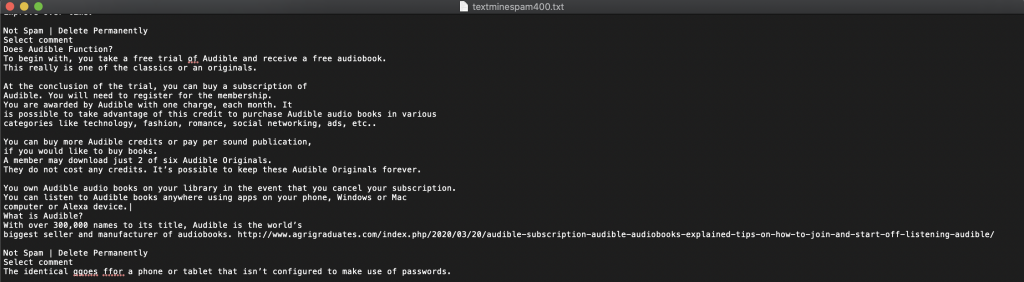
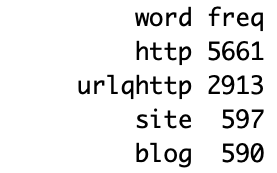
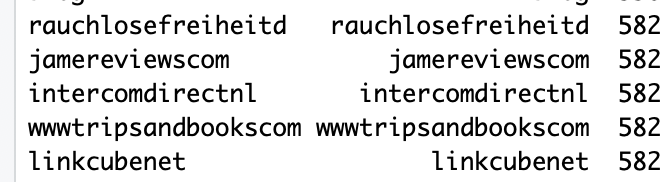
    Do bookmark this site, leave a comment in the section below, and follow us on our LinkedIn page as we look forward to curating new content for you every week. Next, do read about how we used Google Analytics to Analyse our top and bottom posts of 2020, or on how we text mined 400 spam comments!

    Image Credits: Photo by Hari Panicker on Unsplash
    Artwork Designed by Tan Wei Xiang

  • Using Google Analytics to Discover our Tops and Flops of 2020

    Using Google Analytics to Discover our Tops and Flops of 2020

    Welcome to our first post of 2021! As promised in the previous post to be more regular in posting the various topics in this blog, we are kick starting the year with analytics to discover our top 5 and bottom 5 posts (credit the tops and flops inspiration from one of my colleagues who loves to use that in her weekly review at work), to better understand the content which interests you, the reader!

    From the cover slide, we can somewhat see that the traffic has been rather cyclical, perhaps we can expand more on that trend in future but today, let us take a look at the top 5 and bottom 5 posts in the past 6 months. While we are currently 1200 users strong, you might also be interested in looking at our previous Google Analytics Analysis of our first 500 users.

    When dealing with analytics, as usual, we want to ask questions which we want to answer. Through the behaviour overview, and full report of Google Analytics we want to know what our best and worst performing posts were.

    What are our Top 5?

    We were able to discover our top 5 posts (In terms of viewership, from the highest to lowest):
    1. Nanyang Business School Business Analytics Module Selection Guide
    2. 3 Reasons Why I picked a Specialisation in Business Analytics at Nanyang Business School
    3. University Internship Hunting Guide (Tips from NTU NBS Graduate with 3 MNC Internship Experiences)
    4. General and Unrestricted Electives Guide – From NBS Business (Business Analytics) Graduate
    5. Which Major to Pick? Business Analytics vs Marketing (Ex-NBS Student)

    These 5 posts contribute to a total of 37% of all our page views, even though they made up about 25% of all content.

    What are our Flop 5?

    We also managed to pick out our flop 5 posts (From the lowest to highest in viewership):
    1. COVID-19 Pandemic: Should I Start Work or Go Back to School?
    2. Business Model Template: Photo Studio
    3. 6 things to do for 2 Hours in Stuttgart, Germany
    4. Integrating Analytics and Management: Where and How to Start?
    5. Key Takeaways from my In-office turned Work-from-Home Internship

    These 5 posts contribute to 4.2% of all our page views, much less than the 25% of all our posts in 2020.

    Additional Remark: The clear bottom fodders were the newer posts of Christmas Text Analytics and Hair Salon Business Model which we would exclude from the analysis as they have yet to pick up, but I urge you to take a read as they are really interesting posts!

    Making sense of the insights

    Our Age Demographics for readership shows that 60% are youths, and a good 40% are non-youth readers.

    From the top 5 posts, there is a clear indication that many students visit us and rely on the information posted here for advice on their curriculum needs. We are really humbled to be able to create impact for the student audience as we always try to pay it forward after learning from the knowledge of seniors and we urge you to pay it forward in future too!

    We also noticed that it was an interesting trend that 40% of our users are a non-youth audience, and we are heartened that we are able to communicate analytics and innovation to an audience that we initially did not imagine to create impact for. Do let us know which content you love in the comments below!

    For the flop 5 posts, one of the central themes which surround these posts is for instance, it being no longer specific to analytics, which we relaunched the blog on (yes we used to include lifestyle posts and travel.), or the very slight reference to the epidemic which shall not be named since this is risk of lowering the search engine score of this post (we instantly apply these insights!!). We hope to continue bringing new content and will continue to generate more content which caters to your hunger for learning about analytics, innovation and management!

    Additional note: We initially wanted to add in a text analytics, but we realised that there isn’t enough posts to do that on this post without getting just words that are repeated non-stop. If you liked the text analytics, you could look at our ranked 6th post, What I learned from Text Mining 400 Spam Comments on my Blog using R, to see what spam users like to write in our comments section.

    If you liked our post, do bookmark this site, or follow us on our LinkedIn page as we look forward to creating new content for you every week. Wishing you a Happy 2021!!!

    Image Credits: Original Image created by Tan Wei Xiang

  • Nanyang  Business School: Business Analytics Module Selection Guide

    Nanyang Business School: Business Analytics Module Selection Guide

    You have finally decided that you want to do a business analytics curriculum, and want to know what you have in store for you in analytics; you log into the system and find out that there is so many courses available (correct as of July 2020):

    Specialisation Core Courses

    BC2402 Designing & Developing Databases
    BC2406 Analytics I: Visual and Predictive Techniques
    BC2407 Analytics II: Advanced Predictive Techniques

    Specialisation Prescribed Electives –
    Choose 3 Specialisation Prescribed Electives:
    AC2401 Accounting Information Systems
    BT2403 Service Operations Management
    BC2408 Supply Chain Analytics
    BC3402 Financial Service Processes & Analytics
    BC3405 Lean Operations & Analytics
    BC3406 Business Analytics Consulting (I did this)
    BC3408 Decision Modelling & Analytics (I did this)
    BC3409 AI in Accounting and Finance
    New Course Programming for Business Transformation

    Information from NBS Website

    Business Analytics Core

    The three cores are necessary to take and you would not be able to avoid them. Something new to you is probably the addition of prescribed electives, where you can pick 3 modules (or more if you want to) to add up to your final degree in Business Analytics!

    Business Analytics Sub-specialisations

    Something you may want to note is that in Business Analytics we unofficially have sub-specialisations too! I have classified according to how seniors have looked at how the courses fit in and also added my own opinion with regard to the newer modules.

    Finance Analytics Track:

    AC2401 Accounting Information Systems (Sem 1 & 2)
    BC3402 Financial Service Processes & Analytics (Sem 2)
    BC3409 AI in Accounting and Finance (Sem 2)

    Operations Analytics Track:

    BT2403 Service Operations Management (Sem 1)
    BC2408 Supply Chain Analytics (Sem 2)
    BC3405 Lean Operations & Analytics (Sem 1)

    Management Science & Analytics Consulting Track:

    BC3406 Business Analytics Consulting (Sem 2)
    BC3408 Decision Modelling & Analytics (Sem 2)
    New Course Programming for Business Transformation

    What modules did I pick?

    Prior to my year, there were modules which form a marketing analytics track. I was really interested in taking those modules, but unfortunately they were no longer offered. I decided to go with the next best alternative, which was in Management Science & Consulting. I took BC3407 R & Python, now restructured to the GER-Core BC0403, as well as BC3408 Decision Modelling & Analytics and BC3406 Business Analytics Consulting. On top of that, I stayed true to my initial interest by doing an unrestricted elective which is offered by the marketing department, BM2507 Marketing Analytics (Unfortunately not a Business Analytics Prescribed Elective though moving forward I hope it gets approved as one as inter-disciplinary knowledge is increasingly important).

    While not the most commonly picked modules by most Business Analytics students, with very little seniors with precedent knowledge, I believe that benefitted greatly from taking the modules which I have taken and look forward to sharing more.

    What modules should you pick?

    At the end of the day, there is no fixed best modules to take, but rather what aligns with your passion and purpose. My advice is to picture where you see yourself in future, and take the modules to build yourself in that direction. Hope this helps with your module planning!

    If you liked our post, do follow us on our LinkedIn, or our writer’s personal LinkedIn Account for more tips.

    Now that you are done with planning your prescribed electives, you may want to read about general and unrestricted electives over here.

    You may also be interested to pick between business and marketing.

    Here’s another blogpost from a senior which I previously got some reviews and found really helpful!

    Photo Credits: Photo by Wengang Zhai on Unsplash

  • What I learned from Text Mining 400 Spam Comments on my Blog using R

    What I learned from Text Mining 400 Spam Comments on my Blog using R

    Hey everyone! Welcome back to another amazing analytics post this week. If you are a frequent visitor of my blog, and somehow made a genuine comment here, you would have noticed your comment never appears. If you saw the screenshot above, out of a total of 999 comments, I have marked 400 as spam.

    I was reading through some really interesting comments on my blog and I was thinking, why not try doing some text analytics to see what are spammers most interested in talking about on my blog.

    Some simple explanation, text mining is a common way to do sentiment analysis on long lines of text which many market researchers do not want to look through. By going through specific text found in the whole data, researchers want to find out what the general public is talking about. In this instance, I want to find out what spam comments are generally being posted to my blog.

    A bit of Data Cleaning: The very manual and boring part…

    I started off by copying 400 comments and saving it inside a txt file. As my professor always said, data analytics is about 80% data cleaning and 20% analysis. I would change the 20% analysis to 19% and add 1% in terms of insights, which is what the business world truly values.

    My First Round of Analysis

    After a whole massive cleaning exercise here are the first set of results, represented in a word cloud of my top 30 most popular words in the spam.

    The most popular keyword is http… Which means people are spamming websites.

    The most popular keyword in the list of comments is http, which many websites start with (https was also likely in the list with the s being removed and recoded as http.) The second most popular keyword is urlqhttp which is probably also a website.

    In 400 posts, there were close to 8000 times http has appeared.

    In 400 posts, there were close to 8000 instances a web address has appeared, which means on average, spammers were posting 20 links to my blog. (They are probably trying to create backlinks to their website to improve their search engine rankings, which also will damage my website search engine ranking if it has too many backlinks out.) Thankfully these comments did not see the light of day.

    Site and blog were the next highest which would make sense to come out 1.5 times per comment. Things like: This is an amazing blog/site, before adding in other things.

    These links all appeared 582 times, which should be more or less safe to assume they are posted by the same poster.

    These websites were also the most frequent in the comments, in the same frequency, it is likely that a bot has been created by a poster to consistently post the same thing over and over again. (Or perhaps he is that free and did it manually.) It was nice to know that spammers on my blog is interested in reviews, trips and books, linking things, and some German place which consists of Freiheit, which means political freedom (Yes, I learned German for 4 years before.). I did not open the links as I was worried of any potential spyware.

    Okay that is enough analysis for today. If you are interested, do drop by for round 2! If the viewership is high enough, I’ll likely run another analysis on more comments in future.

    If you liked the analysis, you may like this analysis too!

    https://tanweixiang.com/what-i-learned-from-analysing-500-new-users-using-google-analytics/

    Otherwise you might want to know how to put analytics and management together!

  • 3 Reasons: Business Analytics at Nanyang Business School

    3 Reasons: Business Analytics at Nanyang Business School

    Having recently graduated in Business Analytics, here are 3 reasons why I picked Business Analytics:

    1. Management Science and Problem Solving Skills

    My biggest takeaway from doing a business analytics degree was that merely knowing how to code in R, Python, SQL, etc does not make you a good business analytics student. Instead, understanding the problem forming and solving framework is key in tackling any business problems which we want to solve. All my modules consisted of heavily hands on projects for me to exercise good business sense, along with a sprinkle of technical and statistical flavour.

    Ultimately, in order to succeed in Business Analytics, it is not about how good your algorithm is, but how your proposed solution solves the problem at hand! While coding is a must-know, it is definitely not the crux of business analytics.

    You may be interested in this article if you would like to get started on bridging between analytics and management.

    2. Classroom Diversity and Versatility

    Business analytics gave me the chance to meet classmates with a variety of interests. I enrolled into business analytics to make an impact in the marketing and management sectors and adding value through analytics. While going through the Business Analytics curriculum, I managed to also embark on Human Resource projects, as well as a real-life business analytics consulting project with Aon. Do stay tuned in future for updates.

    I had the opportunity to interact with friends working in various sectors, including Finance, Supply Chain, Logistics, Consulting, Data Science. Previously, I had internships in Market Intelligence, Digital Marketing, Product Marketing and Human Resources in the Automotive, Information Technology and Medical Devices sector. Currently, I’m putting my knowledge to the test in the retail sector!

    Hence, you can see that the beauty of business analytics is that it can be used anywhere!

    In the meantime, here is a post on how to maximise your experience in Business School!

    3. Relevance of Business Analytics in Industry 4.0

    Initially, I took business analytics to future proof myself. All around the world, we hear buzzwords like Industry 4.0, or big data being the next big thing. Especially in Singapore, there is an increased emphasis on Technology and Analytics. All the universities in Singapore have started offering analytics as part of their degree programme offerings. In NBS, the analytics cohort in 2018 (Based on the database classes, our core module) was 4 classes, in 2020 it has almost doubled to 7 classes. Therefore, we can see a clear increase in supply of classes to meet the increasing industry demand. (Hope you like the casual economics, and fun fact some countries call business analytics econometrics!)

    Do stay tuned to some of my future blog posts on my Business Analytics curriculum review as well as other topics in the near future!

    Next, you may want to read this module selection guide if you have decided on Business Analytics! Otherwise, you may want to read this to select your General and Unrestricted Electives.

    We have also did a tiering of modules in NBS and NTU on our Youtube Channel!

    If you liked our post, do bookmark this site, or follow us on our LinkedIn page as we look forward to creating new content for you every week.

    Image credits: Photo by Luke Chesser on Unsplash