Marketing post this time! It’s the 4th post of the year and if you followed the narrative it’s time for a marketing post! Recently, I had the chance to carry out end to end planning and execution of a marketing research for my work on Branding and Pricing Strategy.
I learned marketing research in school, and ran researches while at NTU Students’ Union. Planning, fielding and analysing. Back then, I didn’t realise how hard fielding was. It was just a mass EDM (Email Direct Mailer not Electronic Dance Music) to the whole school, and gifts were provided to participants.
Marketing Research: Problem
Initially, I thought that fielding this survey would be a walk in the park. How hard can it possibly be? I could not have been any more wrong than that.
After 4 hours at night, standing outside the supermarket with aching arms and legs, there was only 15 respondents, half of what I planned to get in half the time. Reflecting on the experience, I faced 3 main problems:
Firstly, I was abruptly cut off and rejected on introductions.
Good Evening, I’m a Market Researcher from Company X……
I believe that the lag time before running away would likely be glancing for free gifts or maybe something else.
Secondly, I held my tablet with one arm, and definitely that was not the best thing to do. Furthermore, I was travelling with a laptop slung on me inside my bag. As a result, my body was aching all over at the end of the day.
Thirdly, many people were rushing for time and could not take 5 minutes off their schedule to complete the survey.
Either way, my study received minimal participation.
Marketing Research: Solution
After an unsuccessful night, I needed to find a simpler way to get participants to take part in the survey. With careful thought, I thought of 3 solutions:
Solution #1: Refine the Pitch, Starting with Pain Points
I figured out that the first few words spoken influences if customers will continue to listen, and to tie it to their interests. For instance, I did this pitch:
We’re looking at improving our product offering in Company X. Can we take 5 minutes of your time for a short survey?
I started with the customers’ pain point, basically what they came to the supermarket for — to meet their needs.
Naturally, more customers became open to conversation, especially when their needs are met.
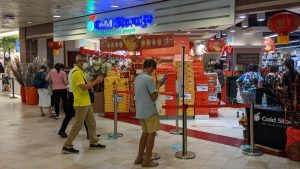
Solution #2: Travel Light and Position Strategically
When I turned up for the second day of the survey, I left my laptop at home, only armed with my tablet and QR Code (More on the QR Code Later). Besides that, I also found a place to station at. This meant that I did not need to carry the heavy tablet for the whole day, and could focus on delivering the pitch and executing the survey! The location which I picked also has some foot traffic, which allows more chances to deliver the pitch!
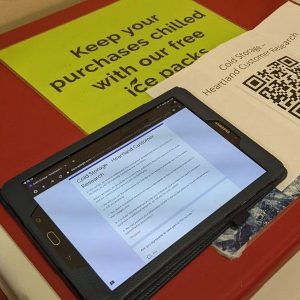
Solution #3: Explore Alternative Methods for Participation
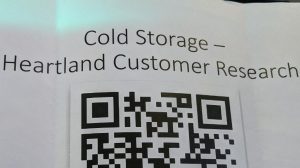
If the customers are rushing for time and just have no time, you can bring the survey to them! I printed a QR Code to allow customers to scan and carry out the survey on the go, which solves the rush hour problem. In addition, when I went to the store on a weekend, I noticed the long queues forming. Instantly, I jumped onto the opportunity to survey the customers in the queue! When customers are already there and do not spend additional time, they are more open to being surveyed!
Marketing Research: What more can be done?
While I did finish my survey after 3 days? What could I have done better? If I had more time to plan, I would have set up an actual booth, and prepare gift vouchers from the company as incentive for taking part in the survey.

Closing Words
Finally, I hope that this reflection provided a new perspective on improving your quantitative marketing research. I wish you aspiring market researchers the best of luck in your next research!
If you liked this post, do check out our course review on the Mini Masters in Marketing Management at NBS, where I have also reviewed about the marketing research course.
In addition, if you liked reading about this post, do follow us on our LinkedIn Page. Also, you might want to read about learning analytics versus marketing!
Image Credits: Original Photography from Tan Wei Xiang